Reporting/Dashboard
The Reporting/Dashboard section provides access to Robusta Orchestrator's analytical dashboards, powered by Kibana. Here, users can monitor system performance, process execution, and worker activities through predefined or custom dashboards. Access is available via the Robusta management panel or a direct URL.
Dashboard Access
-
Access the Robusta RPA Dashboard by clicking the Reporting icon from the Robusta management panel or by navigating to
https://xxxxx.xxx:5601in your browser.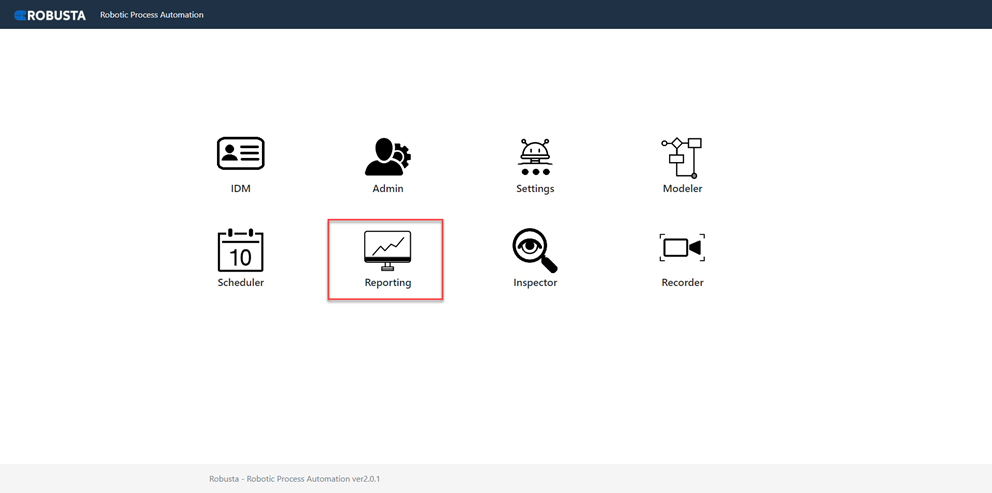
-
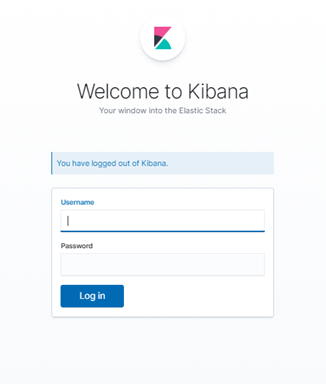
The Kibana login screen will appear. Log in using your provided username and password.
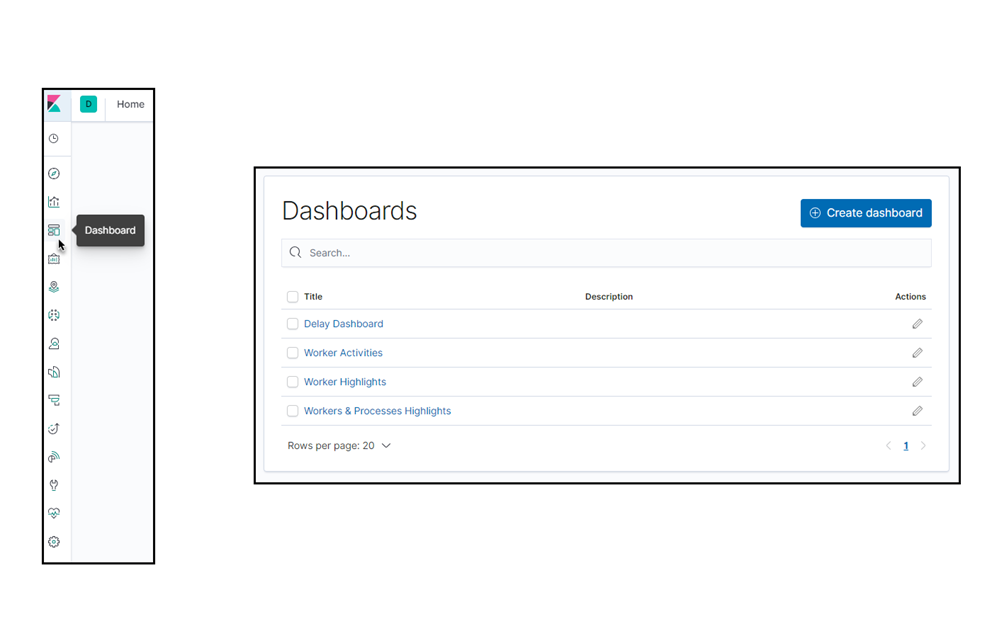
- After logging in, click the Dashboard title in the left navigation bar.
- The predefined dashboard list will be displayed.
To create a custom dashboard, click the Create Dashboard button located at the top right of the screen.
Dashboard Features
The dashboard interface provides several features for viewing and managing data:
| Element | Description |
|---|---|
| Full Screen | Displays all graphs and numerical indicators in full screen. |
| Share | Provides options to share instant or live dashboard data via embed code (iFrame) or permalinks. |
| Clone | Creates a new dashboard by copying an existing one. |
| Edit | Allows modification of the dashboard layout, including moving, adding, deleting, or editing charts and their displayed information. |
| Search | Filters and displays specific charts by name. |
| Schedule | Selects a specific time range for data viewing. |
| Refresh | Updates the displayed data. |
| Add Filter | Filters data based on panel fields and values, allowing focus on specific processes or users. |
| Options | Accessed via the "..." button on any panel. Provides detailed panel properties, full-screen view, and an "Inspect" option to view and save panel data as a CSV table. |
Related Articles
- Delay Dashboard
- Worker Activities
- Worker Highlights
- Worker & Process Highlights