Delay Dashboard
The Delay Dashboard provides an overview of the execution times for triggered and queued processes within Robusta Orchestrator. It allows users to monitor delays and review performance reports across seven distinct panels and tables.
Delayed Processes in Minutes
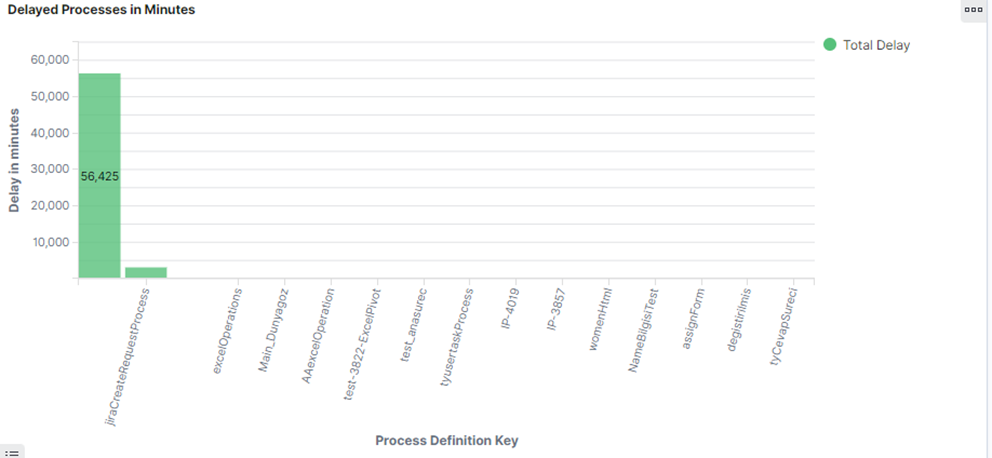
This panel displays the total delay experienced by processes, aggregated by key process information, based on the selected time interval.
Delayed Processes by Process Instance Name
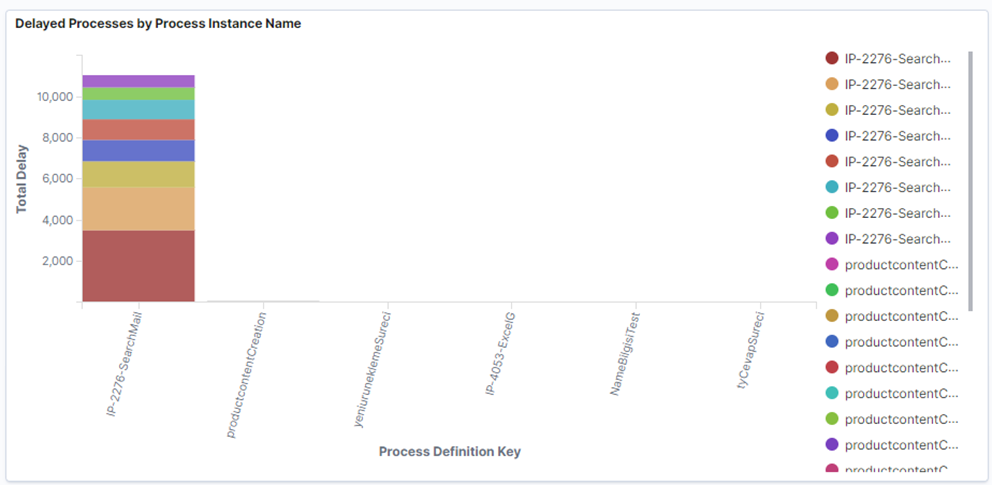
This indicator shows the delay experienced each time a process instance is triggered. It details delays for individual process instances based on their unique triggering conditions.
Total Delayed Processes by Worker in Minutes
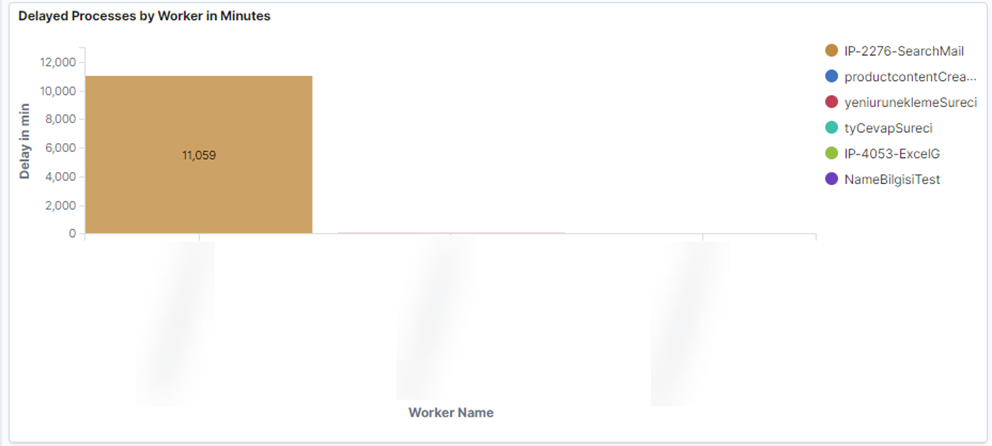
This panel provides an overview of total delays experienced per worker. It helps identify worker-specific delays, aiding in load balancing across multiple workers.
Delayed Process Instances by Worker in Minutes
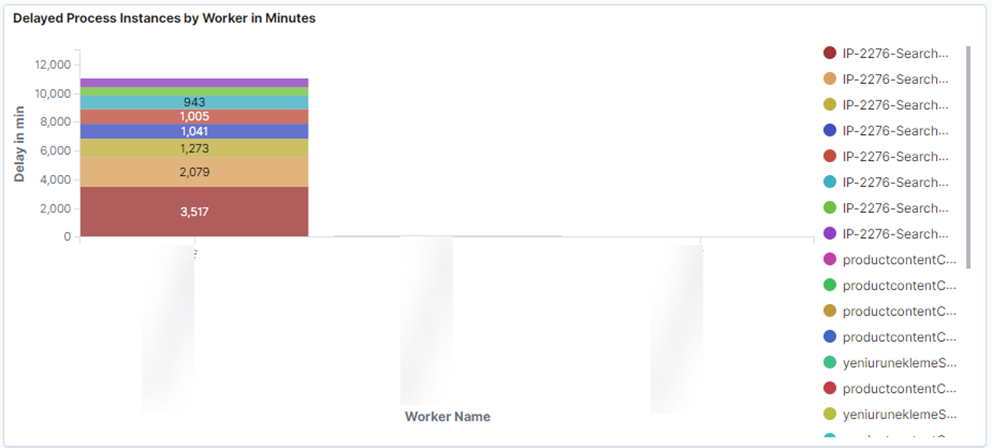
This panel details the delay experienced by individual process instances on a per-worker basis. It allows users to identify specific delayed triggers, their duration, and supports worker load balancing based on delay patterns over time.
Delayed Processes by Top 5 Workers in Minutes
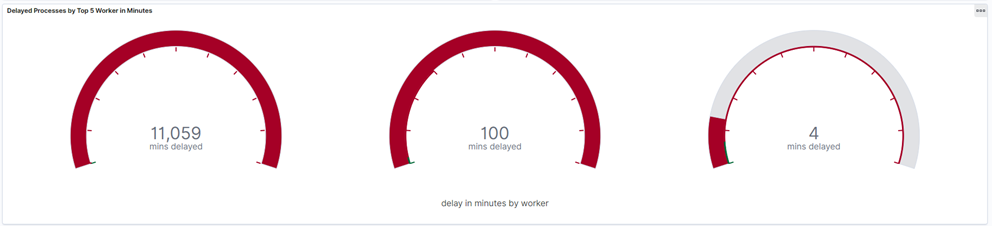
This panel highlights the top 5 workers experiencing the most significant delays, ordered by the magnitude of the delay.
Delayed Processes by Process Definition
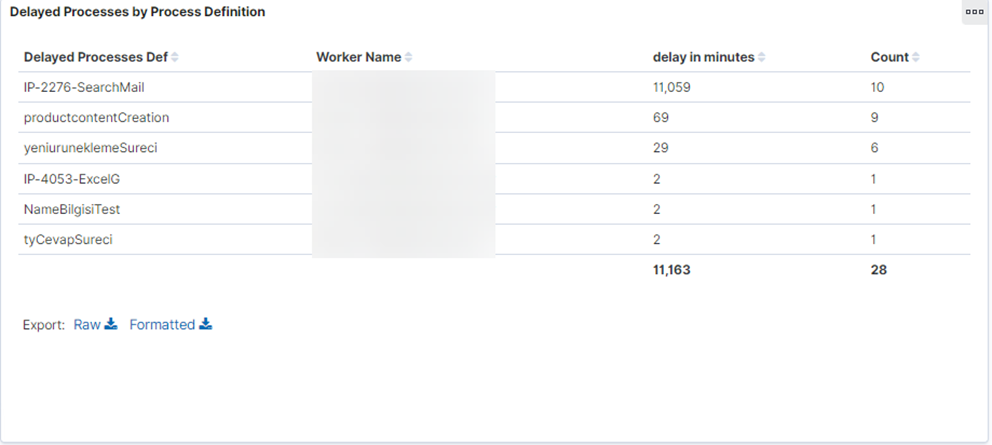
This table displays delays categorized by process definition. It shows which processes are delayed, the total delay duration, and the number of triggers contributing to these delays.
Delayed Processes by Process Instance
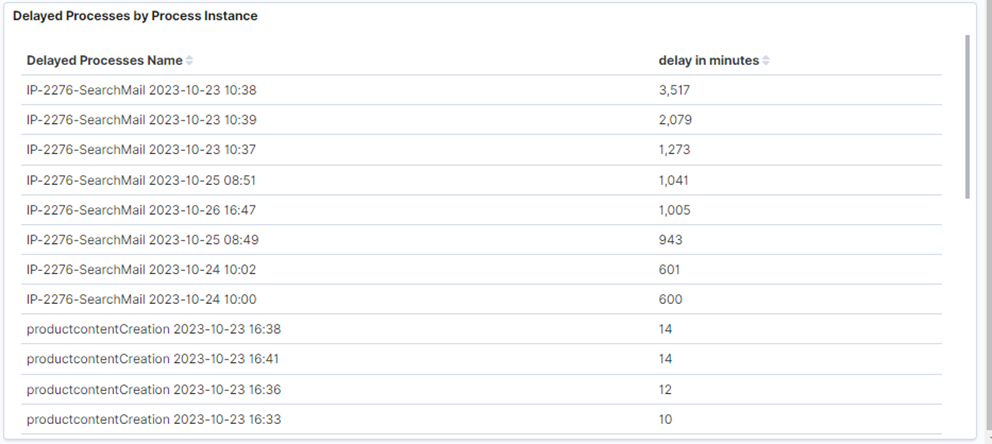
This table provides a detailed view of the delay duration for each individual process instance when triggered.