Worker Activities
The Worker Activities Dashboard provides a comprehensive view of worker performance and process execution within Orchestrator. It allows users to monitor worker activity duration, process execution counts, worker busyness over time, and other critical operational metrics. This dashboard comprises ten distinct panels and tables:
- Worker-App-Process Selection Filter
- Sum of Process Duration in Minutes
- Sum of Process Duration in Seconds
- Worker-Process Run List
- Worker Process Count by Start Date
- Process Duration by Start Date
- Worker Busyness Chart
- Running Workers
- Running Processes Table
- Waiting Process Queue Table
Worker-App-Process Selection Filter

This filter allows users to narrow down the dashboard's displayed data by specific workers, applications, or processes.
Sum of Process Duration in Minutes
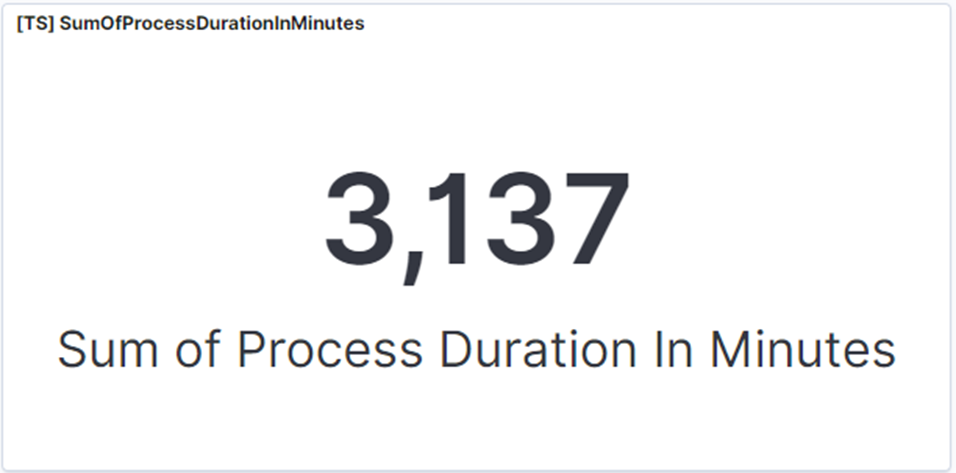
This panel displays the total duration, in minutes, that Orchestrator workers were active during the selected time interval.
Sum of Process Duration in Seconds

This panel displays the total duration, in seconds, that Orchestrator workers were active during the selected time interval.
Worker-Process Run List

This panel shows the execution count for each process. Clicking on a process provides a more detailed, process-specific view.
Worker Process Count by Start Date


This graph displays the number of processes that started on a given date. Users can zoom into specific time ranges (day, hour, minute) for detailed analysis, and this dynamic filtering affects other dashboard panels.
Process Duration by Start Date


This chart illustrates the total duration, in seconds, for processes that commenced within the selected time interval. Users can zoom into specific time ranges (day, hour, minute) for detailed analysis, and this dynamic filtering affects other dashboard panels.
Worker Busyness Chart


This chart visualizes the activity level of Orchestrator workers during the selected period. It helps in analyzing individual worker activity intervals, planning load balancing, and scheduling new processes. Hovering over a specific range provides detailed information about the process status.
Running Workers


This chart provides insights into workers active during the selected time period, detailing the processes each worker executes. Hovering over a specific range provides detailed information about the process status.
Running Processes Table

This table lists currently running processes, including information about the initiating user, the assigned worker, and the process start date.
Waiting Process Queue Table

This table displays processes currently in the waiting queue, showing their trigger time, user information, and process name.