Worker & Process Highlights
The Worker & Process Highlights Dashboard provides a comprehensive overview of worker and process execution within Orchestrator. It displays key metrics such as start times, completion statuses (successful, failed, canceled), and worker-specific process activity. This dashboard features 20 distinct panels and tables for detailed monitoring.
Dashboard Panels
The Worker & Process Highlights Dashboard includes the following panels and tables:
| Panel | Description |
|---|---|
| Running Processes | Displays the count of processes executed within the selected time interval. |
| Success Processes | Shows the number of successfully completed processes. |
| Failed Processes | Indicates the count of processes that failed. |
| Cancelled Processes | Presents the number of processes that were canceled. |
| Process Selection Filter | A filtering interface for Worker, Application, and Process. |
| Most Used 5 Workers | Identifies the top 5 workers by process count. |
| Most Used 5 Workers by Processes | Details which processes the top 5 workers executed and how many times. |
| Most Used 5 Processes | Highlights the top 5 most frequently run processes. |
| Most Used 5 Processes by Status | Shows the completion status (successful, failed, revoked) of the top 5 processes. |
| End Status Distribution | Visualizes the percentage distribution of process completion statuses. |
| End Status Table by Process | Provides a table of failed processes and their statuses. |
| Most Used 5 Workers by Start Date | Tracks daily process execution counts for the top 5 workers. |
| Most Used 5 Processes by Start Date | Tracks daily execution counts for the top 5 processes. |
| End Status by Start Date | Displays daily process completion statuses. |
| Process & Status by Latest 5 Worker | Shows processes run by the last 5 workers and their completion statuses. |
| Average Duration of Top 10 Processes in Minutes | Calculates the average duration for the top 10 processes. |
| Top 10 Failed Reason of Transactions | Lists the primary reasons for process failures. |
| Status Trend by Worker | Presents a trend of worker process completion statuses over time. |
| Process Status Trend by Date | Shows the trend of overall process completion statuses by date. |
| End Event Name Table by Process | Details the activities associated with failed processes. |
Running Process
The Running Process panel displays the total number of processes executed within the selected time interval on Orchestrator.
Success Process
The Success Process panel shows the count of successfully completed processes within the selected time interval on Orchestrator.
Failed Process
The Failed Process panel indicates the number of processes that failed within the selected time interval on Orchestrator.
Cancelled Process
The Cancelled Process panel displays the number of processes that were canceled within the selected time period on Orchestrator.
Process Selection Filter

The Process Selection Filter allows you to refine the dashboard's displayed information by Worker, Application, and Process.
Most Used 5 Workers

The Most Used 5 Workers chart displays the number of processes executed by the top 5 most active workers on Orchestrator during the selected period.

Hovering over the chart reveals the exact process count for each worker. Clicking on a worker's entry allows for filtering the dashboard based on that specific worker.
Most Used 5 Workers by Processes

The Most Used 5 Workers by Processes chart illustrates which processes the top 5 most active workers executed and their respective execution counts within the selected time period on Orchestrator.

Hovering over the chart displays the process name and its execution count for a specific worker. Clicking on an entry enables filtering by worker and process.
Most Used 5 Processes

The Most Used 5 Processes chart identifies the top 5 most frequently executed processes on Orchestrator during the selected time period.

Hovering over the chart reveals the execution count for each process. Clicking on an entry allows for filtering by worker and process.
Most Used 5 Processes by Status


The Most Used 5 Processes by Status chart presents the completion status (successful, failed, or revoked) of the top 5 most executed processes on Orchestrator within the selected time period.
Hovering over the chart displays the execution count for the relevant process. Clicking on an entry enables filtering by worker and process status.
End Status Distribution
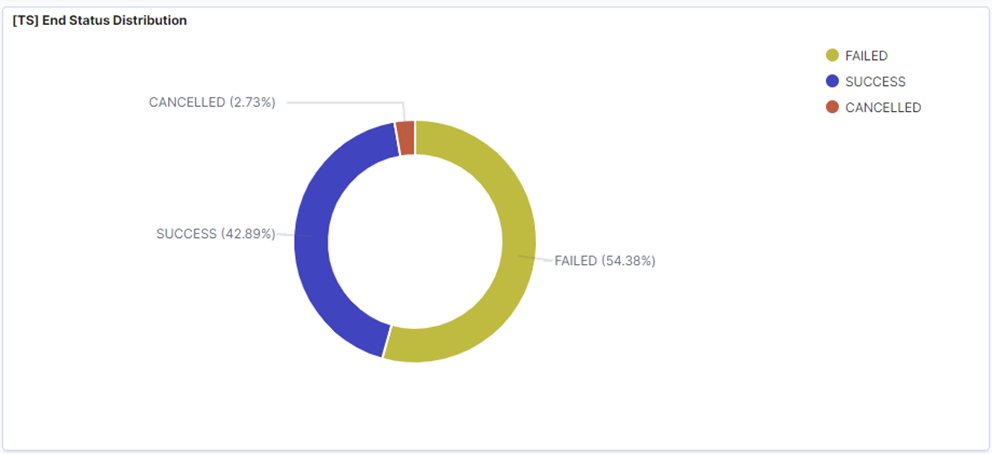
The End Status Distribution chart visualizes the percentage breakdown of successful, failed, and canceled statuses for processes running on Orchestrator during the selected time period.
End Status Table by Process
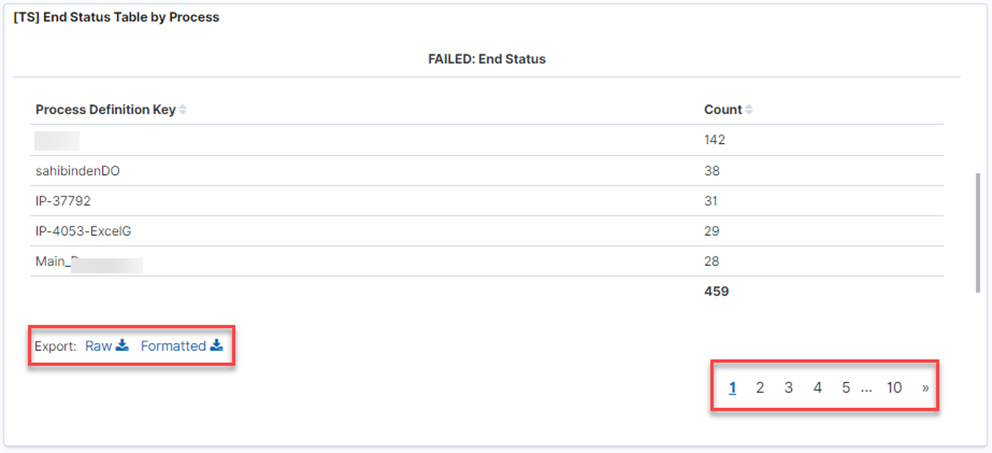
The End Status Table by Process displays a list of failed processes executed on Orchestrator within the selected time period. This table, including all statuses, can be exported via the 'Export' option at the bottom left. Page navigation is available at the bottom right.
Most Used 5 Workers by Start Date

The Most Used 5 Workers by Start Date chart tracks the daily execution count for the top 5 most active workers on Orchestrator during the selected time period.
Most Used 5 Processes by Start Date

The Most Used 5 Processes by Start Date chart displays the daily execution count for the top 5 most frequently run processes on Orchestrator within the selected time period.
End Status by Start Date

The End Status by Start Date chart presents the daily completion status of processes on Orchestrator during the selected time period. Users can dynamically filter the chart and the entire dashboard by selecting a specific time range.
Process & Status by Latest 5 Worker


The Process & Status by Latest 5 Worker chart displays the processes executed by the five most recently active workers on Orchestrator within the selected time period, along with their completion statuses.
Hovering over the chart shows the completion count for the relevant process. Clicking on an entry allows filtering by worker and process status.
Average Duration of Top 10 Processes in Minutes

The Average Duration of Top 10 Processes in Minutes chart illustrates the average execution time, in minutes, for the top 10 most active processes on Orchestrator during the selected time period.
Top 10 Failed Reason of Transactions

The Top 10 Failed Reason of Transactions chart identifies the ten most common reasons for process failures related to tasks or activities on Orchestrator within the selected time period. This chart helps pinpoint error-prone tasks or activities.
Status Trend by Worker

The Status Trend by Worker chart presents a chronological trend of process completion statuses for individual workers on Orchestrator within the selected time range. This allows for identifying which workers succeeded or failed processes on specific dates. The chart and entire dashboard can be dynamically filtered by selecting a time range.
Process Status Trend by Date

The Process Status Trend by Date chart displays the overall trend of process completion statuses on Orchestrator within the selected time period. The chart and entire dashboard can be dynamically filtered by selecting a specific time range.
End Event Name Table by Process

The End Event Name Table by Process lists the specific activities associated with processes that failed on Orchestrator within the selected time interval. The table can be downloaded in CSV format via the export option at the bottom right. Page navigation is available at the bottom left.